5 Essential Project Management Metrics in GitHub, Jira, and Asana: A Comprehensive Guide
Can you easily identify the "trending" or popular issues? Who is completing tasks at the highest rate? Which Pull Requests are most active, and which repositories have seen a surge in activity in the past fortnight?

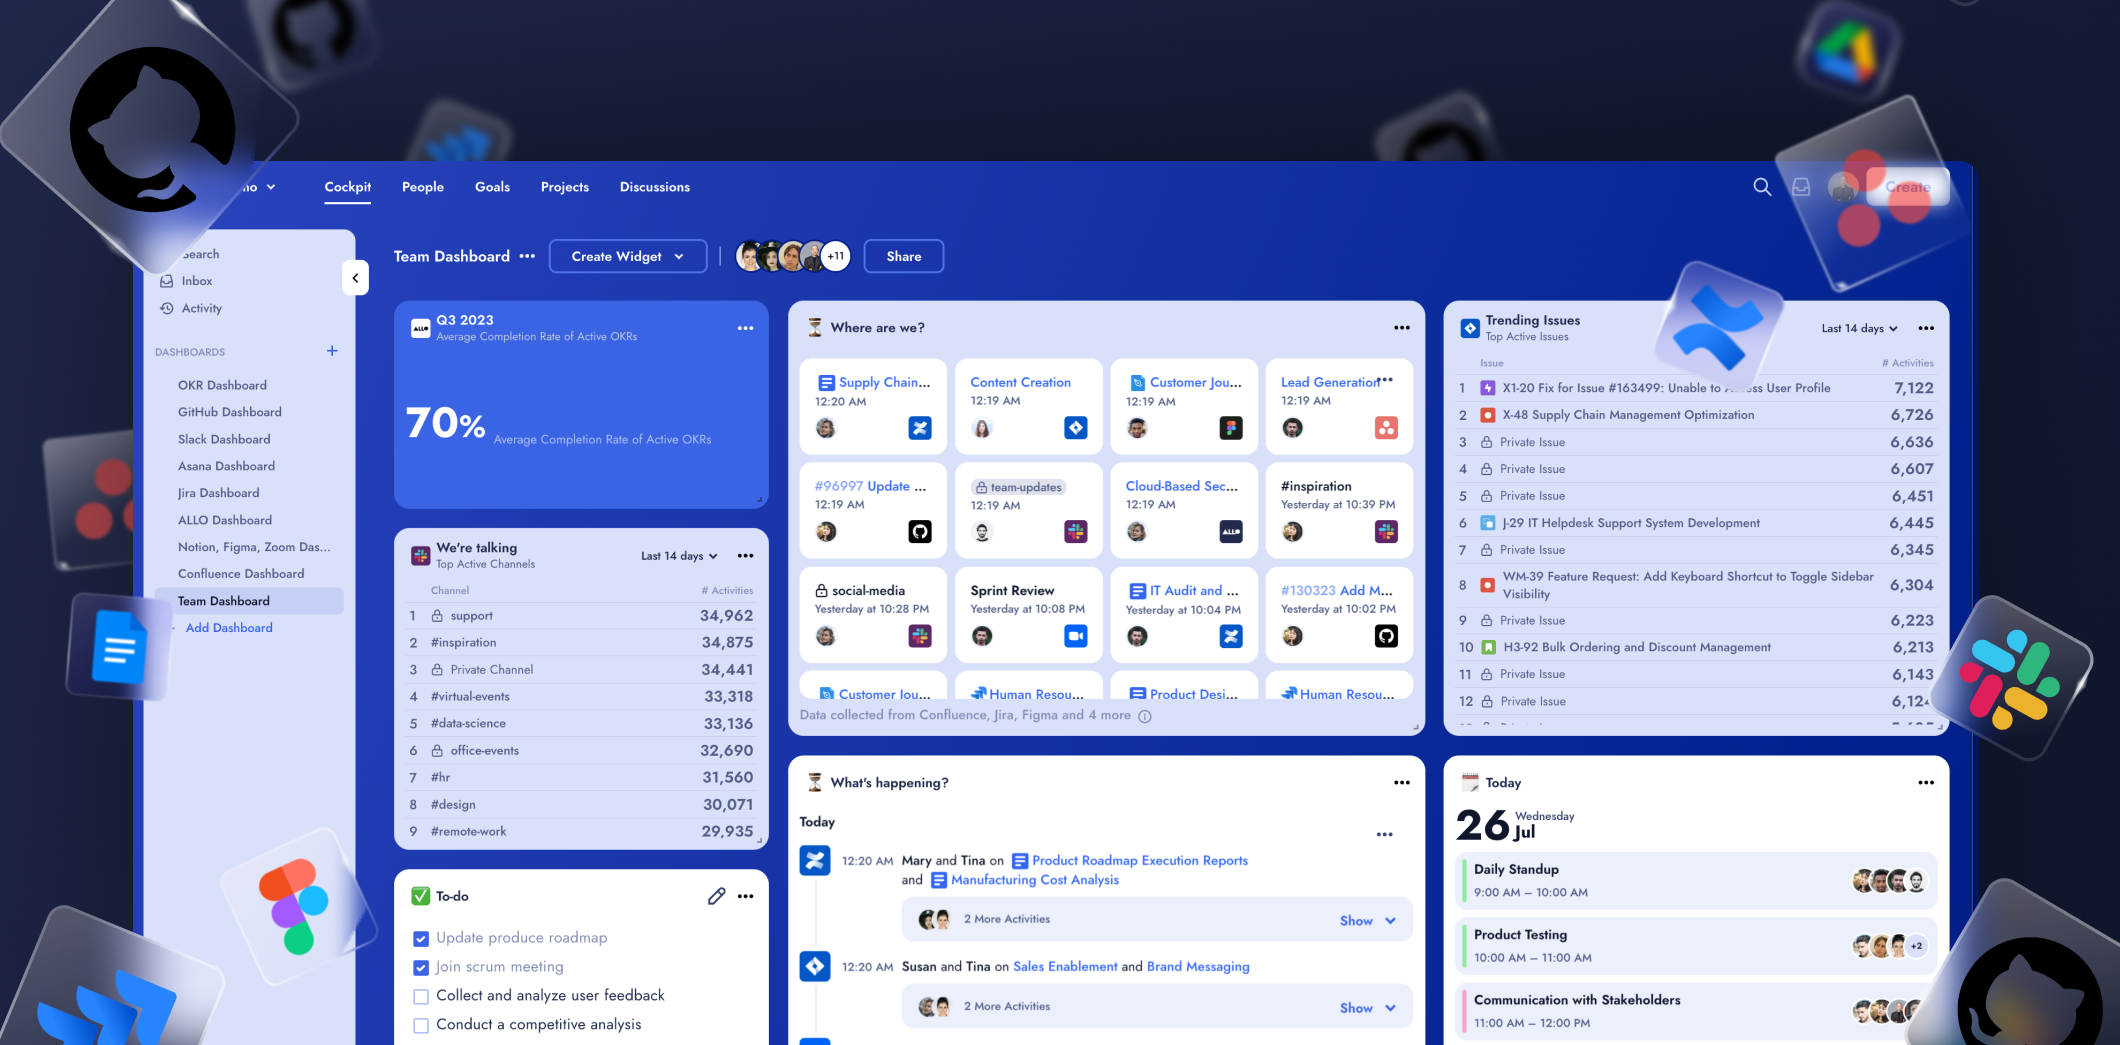
Modern project management has evolved and with it, the tools that teams use to collaborate, communicate, and deliver results. GitHub, Jira, and Asana have become the backbones of many teams' workflows, and rightfully so. But how can managers dig deeper into the data these tools generate, to uncover the lesser-known, underrated metrics that might reveal more about their team's dynamics? Let's find out.
Beyond the Common Metrics
Most of us are familiar with the standard DORA metrics or Agile metrics like Burndown Chart or Velocity, etc, which paint a rough picture of team performance. Yet, they often overlook some crucial aspects. For instance, who is the most engaged with your project, frequently commenting on issues? Who is frequently updating the status, changing due dates, or creating subtasks?
Such "silent" contributors often escape notice in day-to-day communications but may be very active in places like GitHub, Asana, or Jira. Recognizing their contributions can give managers a fuller understanding of their team's dynamics.
Jira does provide dashboard functionalities, but can you easily identify the "trending" or popular issues? Who is completing tasks at the highest rate? Which Pull Requests are most active, and which repositories have seen a surge in activity in the past fortnight?
Digging Deeper: 5 Key Metrics
To answer these questions, we've curated a set of metrics that matter for each platform that deserve your attention.
1. Active Commenters
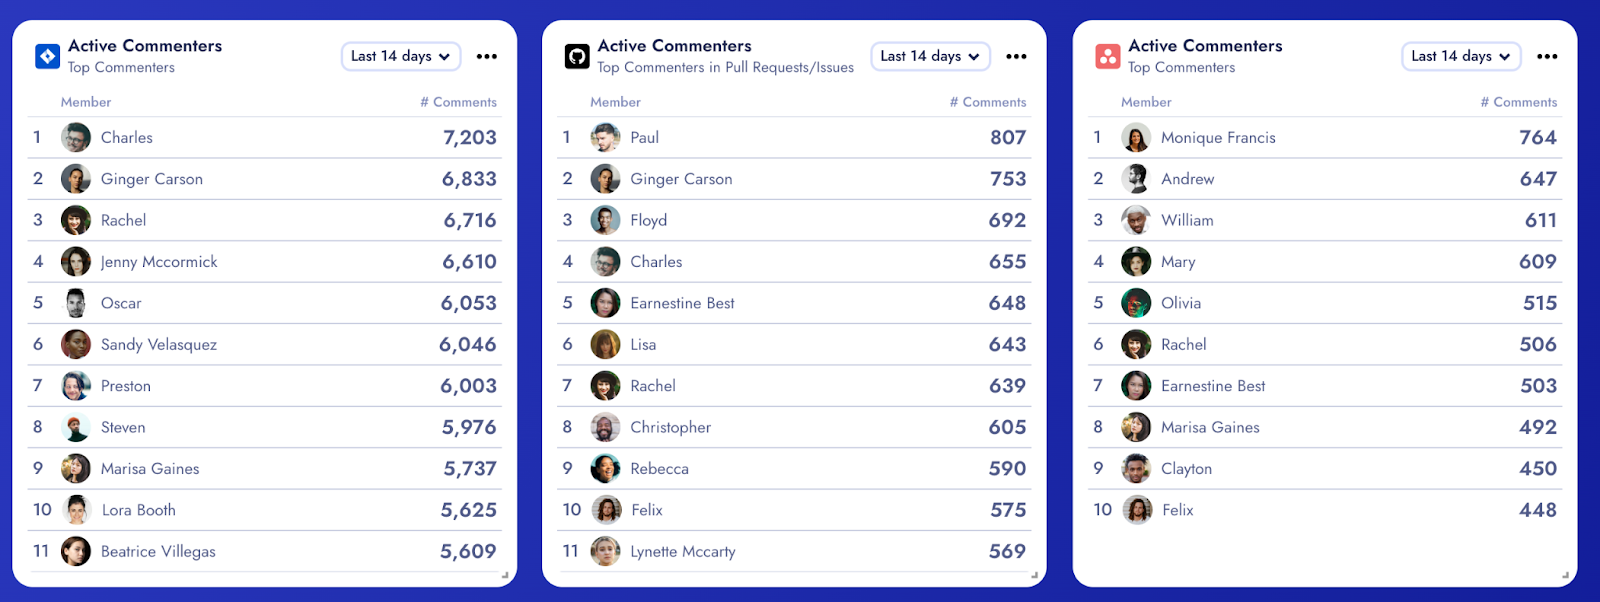
What it is: This metric identifies team members who are actively adding comments to issues in GitHub and Jira, tasks in Asana, and pull requests on GitHub. It takes into account the frequency and recency of comments.
Why it's important: Regular commenting indicates high engagement with the project. These individuals are often deeply involved in problem-solving and decision-making processes. Their comments can provide valuable insights into project progress and potential obstacles
2. Proactive Reviewers
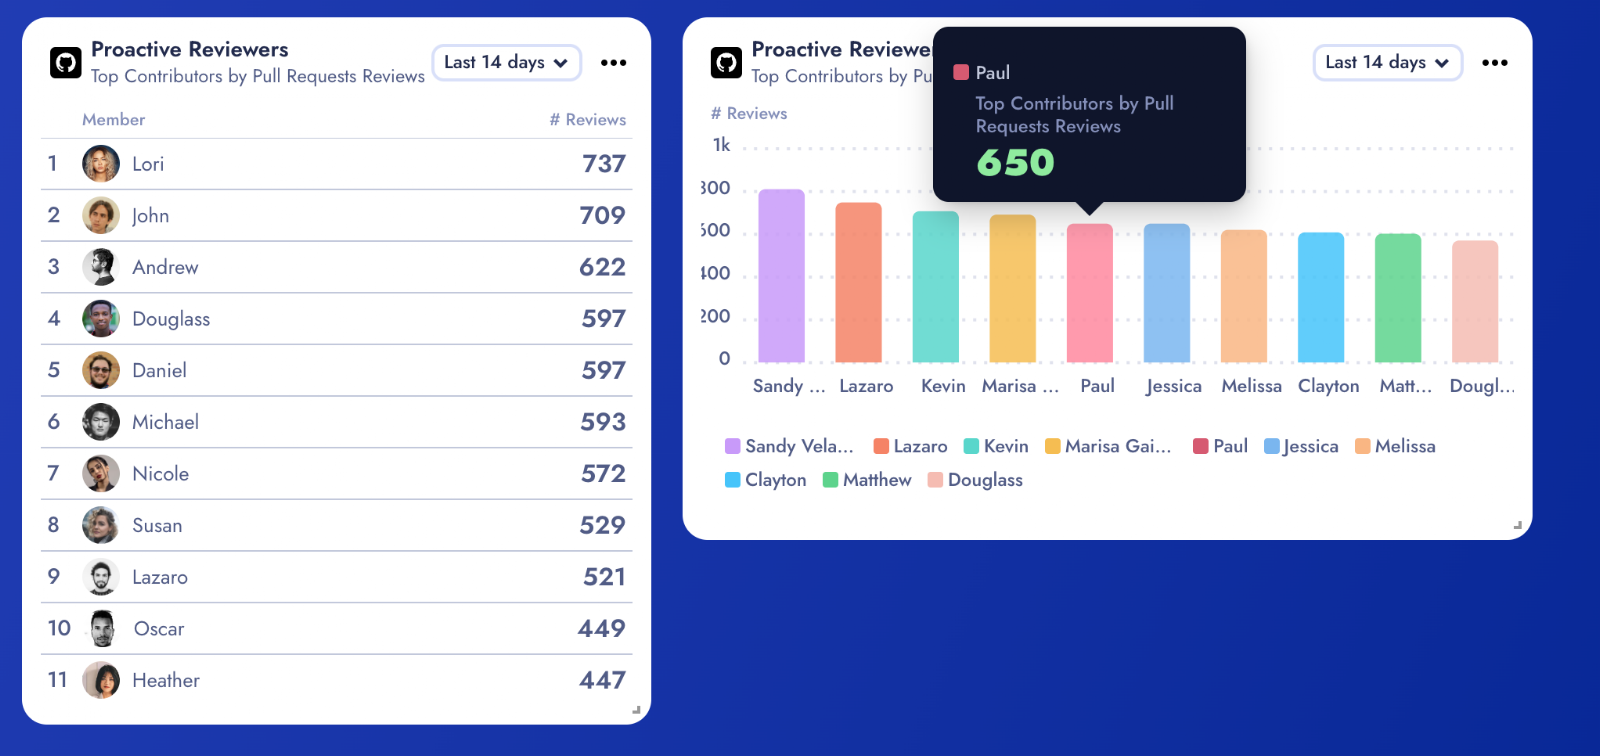
What it is: This metric focuses on team members who are proactively reviewing pull requests on GitHub. It measures not only the number of reviews but also the quality of feedback provided.
Why it's important: Proactive reviewers are vital in maintaining code quality and promoting collaboration. They show care for their peers' work, fostering a sense of collective responsibility for the codebase. However, pull request reviews can often get buried under a flood of notifications, leading to delays that may remain unseen. By identifying these proactive reviewers, you encourage more team members to engage in timely code reviews, reducing potential project delays and promoting better code quality. This practice also complements the implementation of DORA metrics, leading to a comprehensive understanding of your team's performance.
3. Top Task Completers
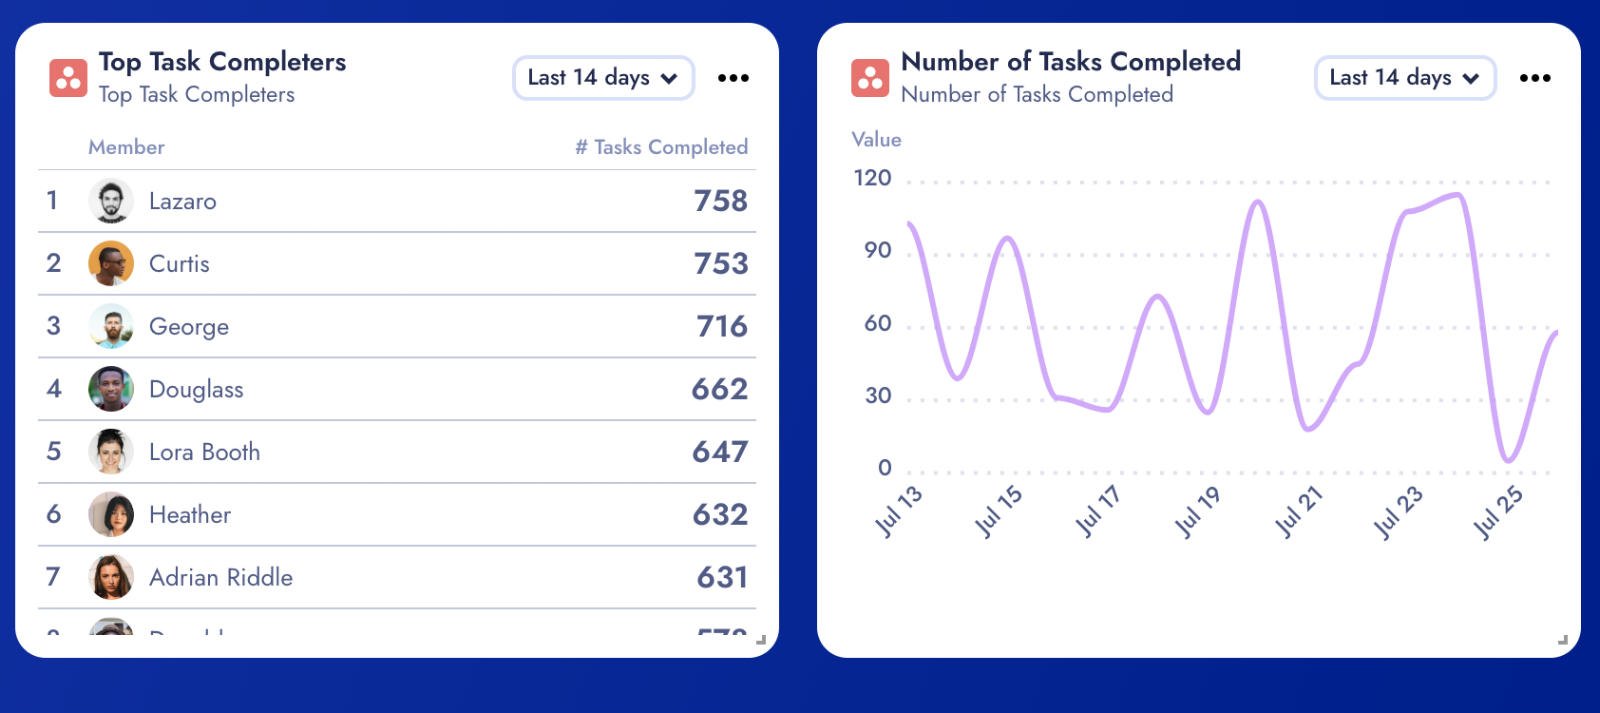
What it is: This metric tracks team members who complete the most tasks on Asana. It evaluates both the volume and complexity of tasks completed.
Why it's important: High task completion often signifies effective time management and productivity. These team members often drive project progress and can be a valuable asset in meeting deadlines and achieving project goals.
This approach towards task completion often leads to increased transparency in project management. The frequent updates keep everyone on the team informed and help anticipate project flow, fostering a responsive and efficient environment. Moreover, such individuals demonstrate a high level of accountability, making them crucial assets for any team
4. Active Issues/Tasks/PRs
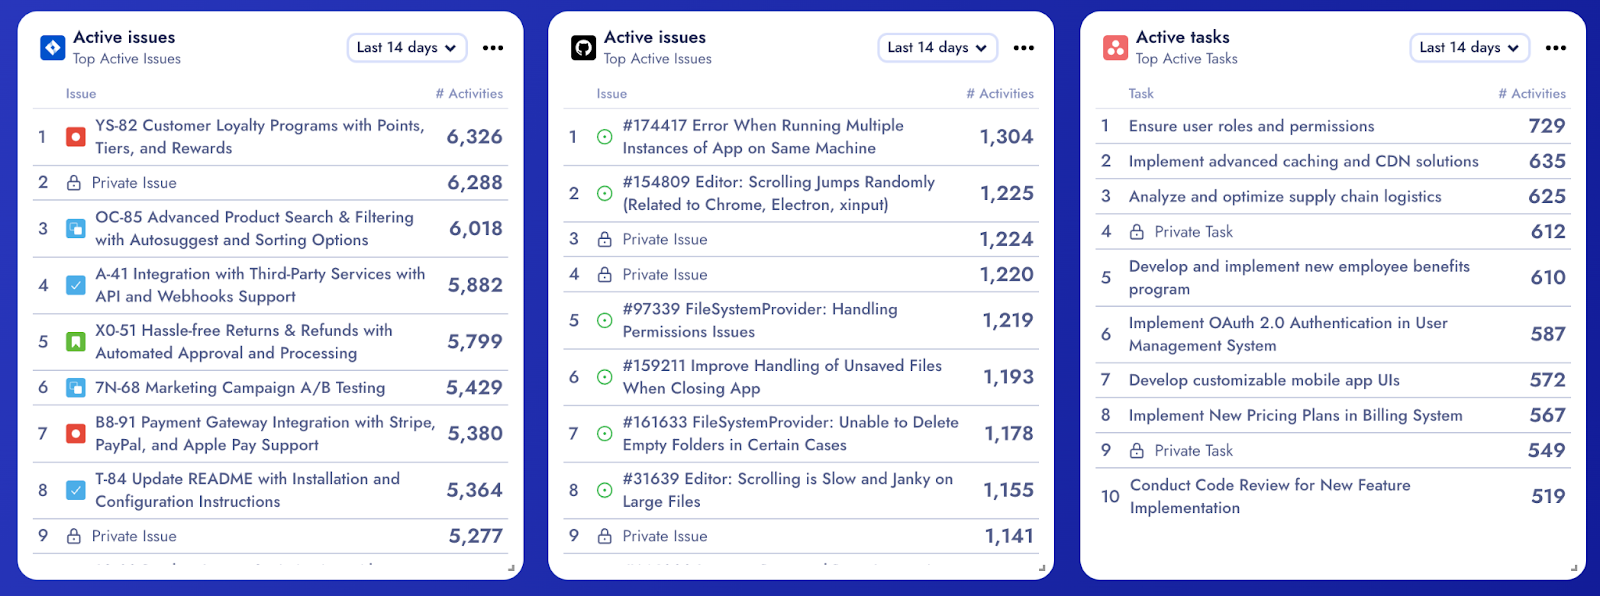
What it is: This metric lists the most active tasks in Asana, issues in GitHub and Jira, and pull requests on GitHub. It considers both the number of participants and the frequency of updates.
Why it's important: Identifying active work items helps pinpoint hotspots of activity and potential bottlenecks. Managers can then take proactive measures to address these issues and ensure smooth project progress.
5. Hot Projects/Repositories
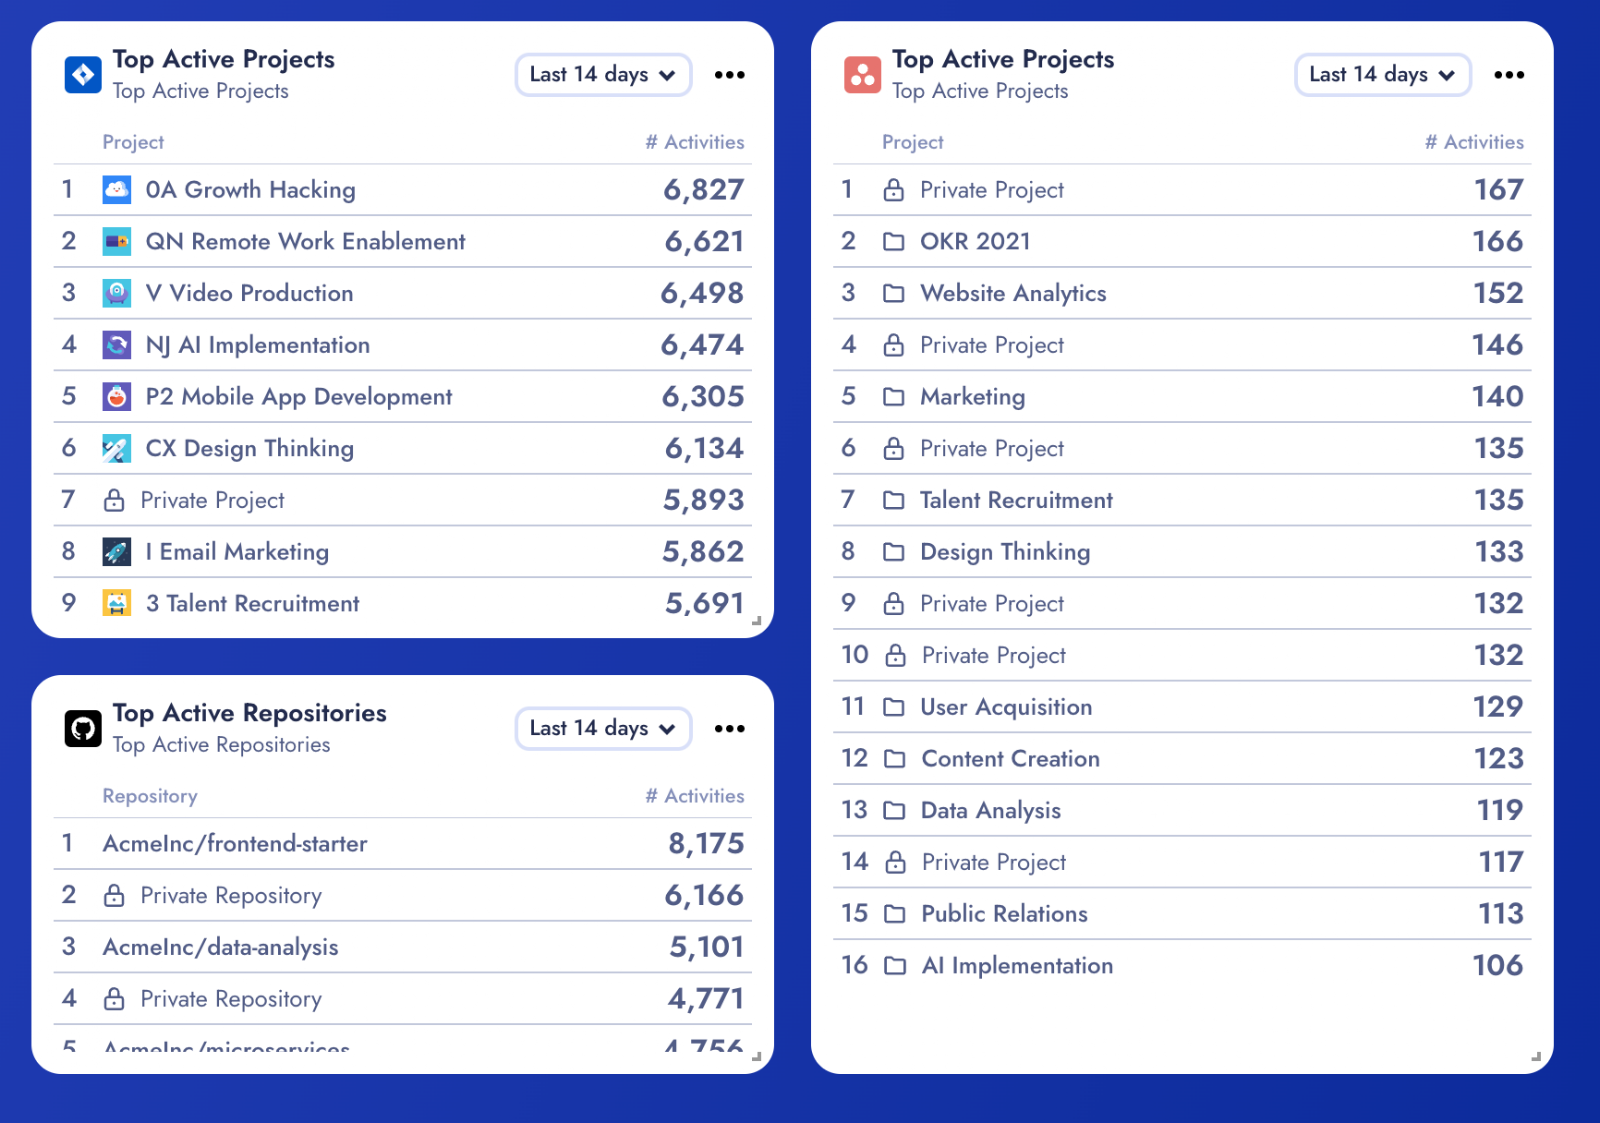
What it is: This metric showcases the most active projects in Jira and Asana, and repositories in GitHub. It is based on factors like the number of active users, frequency of updates, and number of open issues.
Why it's important: Recognizing the most active projects or repositories can guide resource allocation and priority setting. This insight helps managers focus their attention where it's most needed, leading to more effective project management.
The Real Value of Unearthing These Metrics
In remote work, people contribute quietly to projects, and managers often struggle to fully understand how they contribute without visiting every single tool they use. It's not just about who's getting things done, but also why some people are contributing more and how they are doing better than others.
These metrics can provide insights into team dynamics and individual contributions, giving a more granular picture of performance. While you shouldn't incentivize developers by the number of commits pushed, the data obtained can give you a better idea of your engineering team's performance at an individual, project, and repository level.
By digging deeper into these metrics, managers can achieve a richer, more comprehensive understanding of their team's workflows and contributions, which can lead to more effective management and higher team productivity.
Recognizing the contributions of these team members can give managers a fuller understanding of their team’s dynamics and help them make better decisions about how to allocate resources and support their team members. It can also help to boost morale and engagement among team members by showing that their contributions are valued and appreciated.
This is why we created ALLO Cockpit. Our pre-made dashboards offer you instant insights, and they are truly high-value, holistic insights (across all team applications) that you simply can’t get from your existing single team apps alone. And it’s extremely easy to integrate ALLO with your GitHub, Jira, and Asana and other team apps – to start uncovering hidden team dynamics and project progress right away. No more guesswork, only data-driven decisions based on real business insights. Let ALLO Cockpit guide you in crafting a more productive and collaborative work environment – give it a try today.

Sources:
- Good Leaders Acknowledge Their Employees Often
- 5 Insightful Dilemmas Of The Obscure INFJs
- 15 Things Senior Leaders Can Do To Better Support Junior Team Members
- How Managers Can Support Remote Employees
- Best of 2022: How DORA Metrics Can Measure and Improve Performance
- Five agile KPI metrics you won't hate